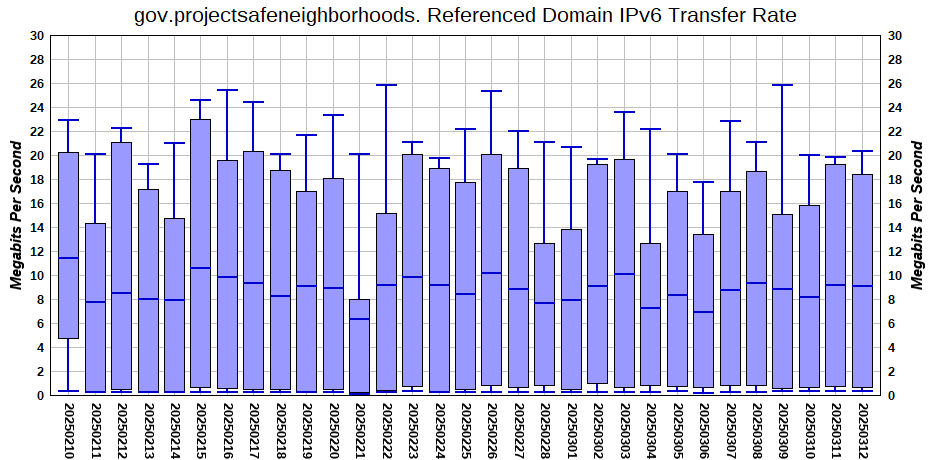
gov.projectsafeneighborhoods.
Referenced Domain IPv4/IPv6 Web Statistics
Background and Methodology
IPv6 & DNSSEC SnapShots
USG IPv6 & DNSSEC Statistics
USG IPv4 Statistics
Industry IPv6 & DNSSEC Statistics
Industry IPv4 Statistics
University IPv6 & DNSSEC Statistics
University IPv4 Statistics
CFO Act Agency Summary Statistics
USG IPv6 Enabled WWW Sites
- Referenced Domain Web Statistics for 2026.07.22 -
gov.projectsafeneighborhoods. |
Department of Justice
v4[s]
v4[B]
v4[Mbps]
v6[s]
v6[B]
v6[Mbps]
6/4[Mbps]
v4|v6
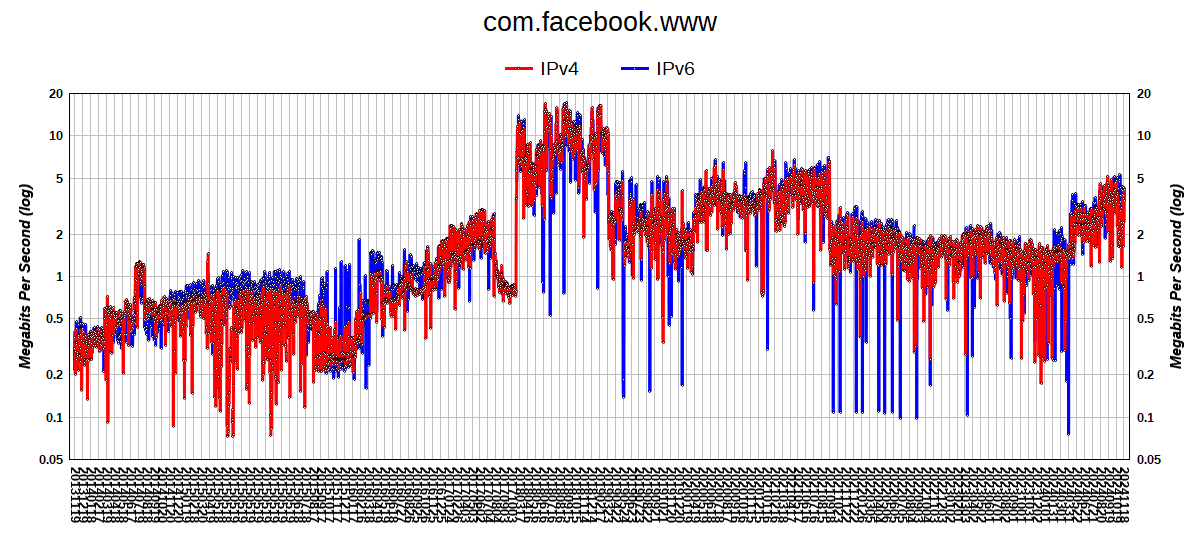
com.facebook.www
(https)
0.601760
426455
5.41
0.593568
423156
5.44
101%
graph
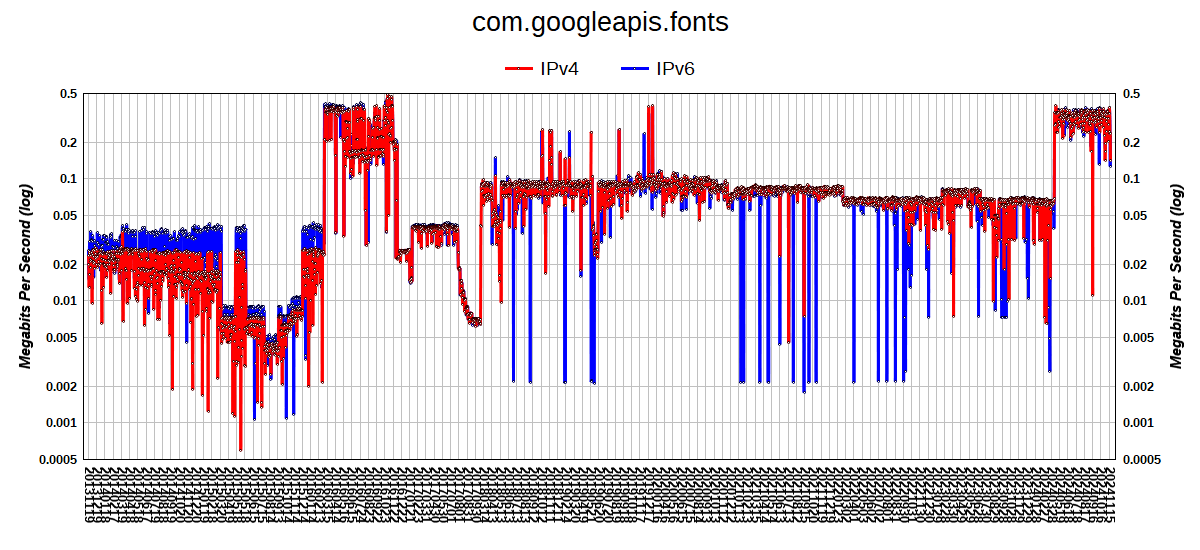
com.googleapis.fonts
(https)
0.044187
1621
0.28
0.043992
1621
0.29
102%
graph
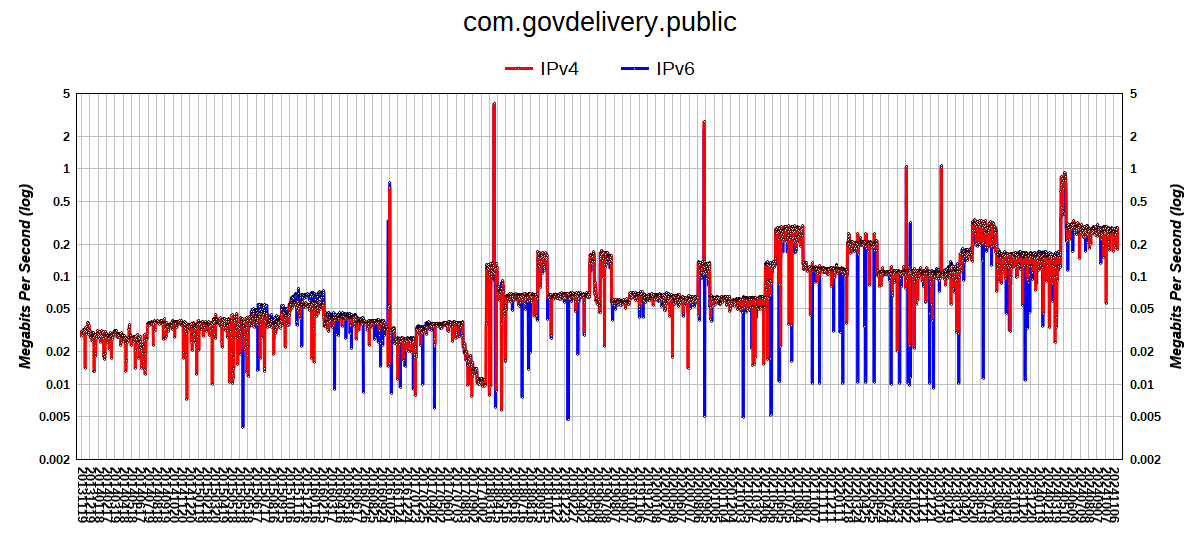
com.govdelivery.public
(https)
[v4R]
1/0.080650s
[v6R]
1/0.056377s
0.159028
7681
0.37
0.099776
7681
0.59
161%
graph
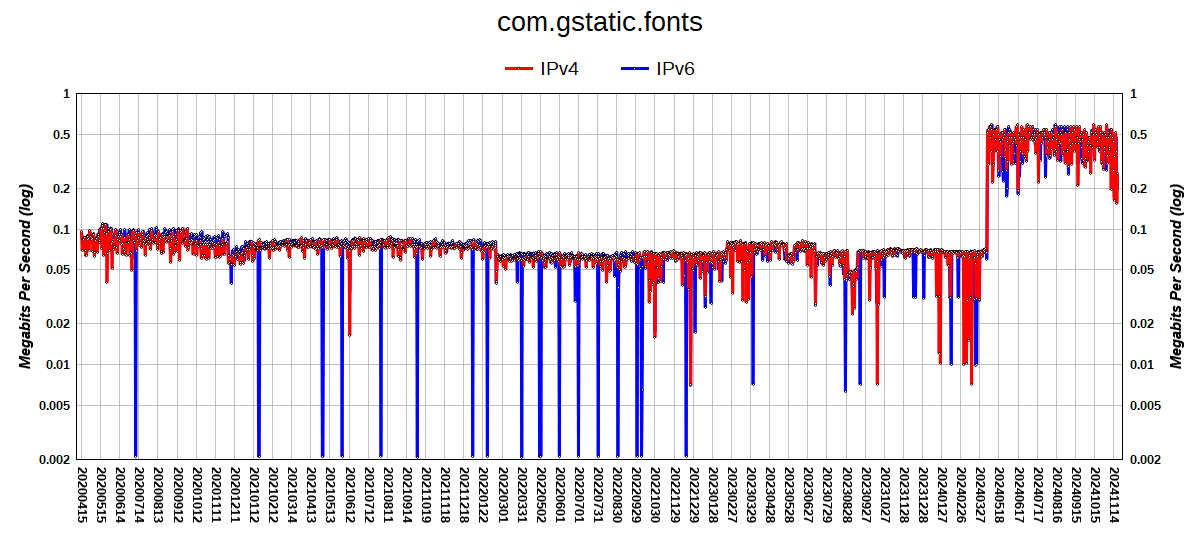
com.gstatic.fonts
(https)
0.028624
1561
0.43
0.046227
1561
0.26
61%
graph
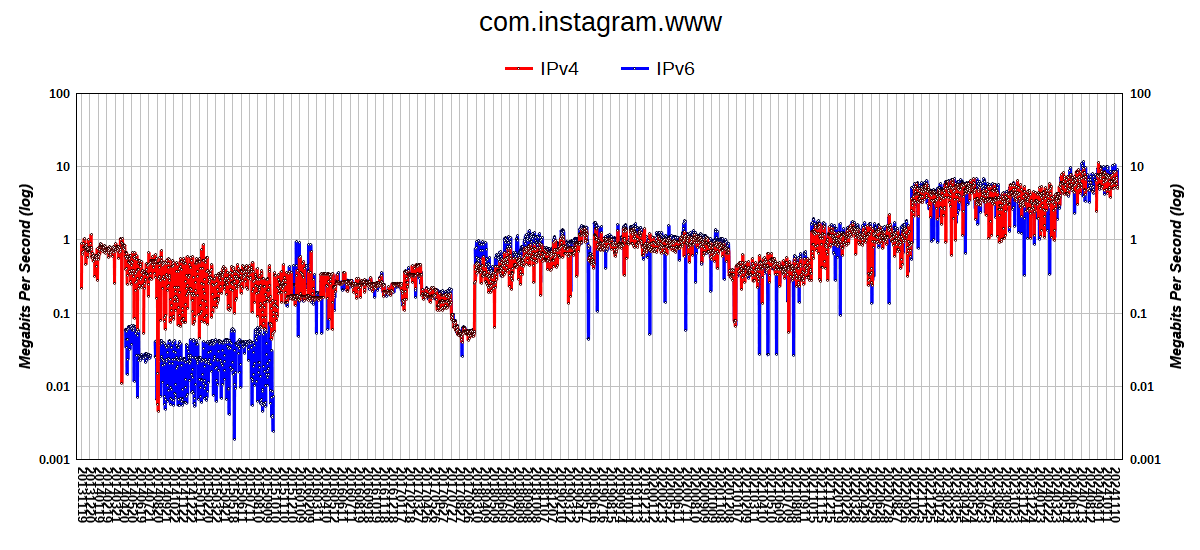
com.instagram.www
(https)
0.455025
395524
6.63
0.729737
395589
4.14
62%
graph
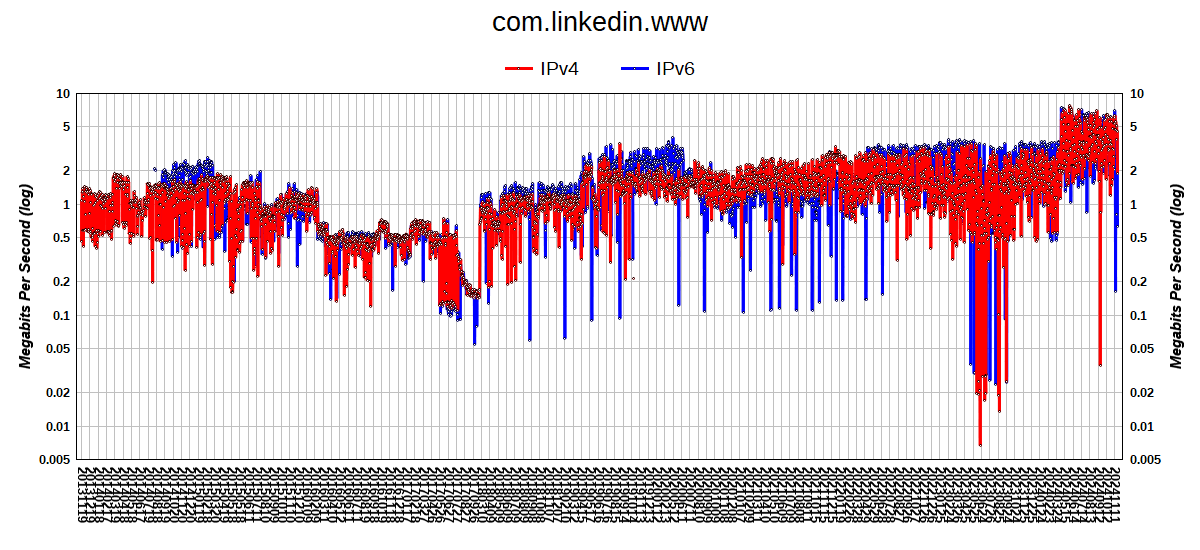
com.linkedin.www
(https)
0.676100
141608
1.60
0.262587
141608
4.12
258%
graph
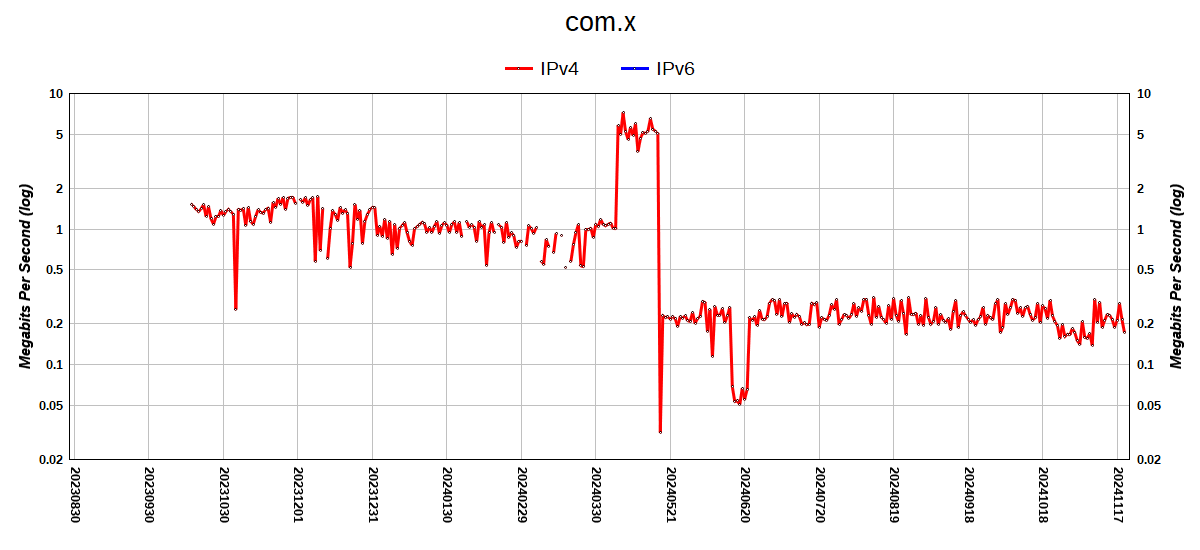
com.x
(https)
0.309220
37059
0.92
0.003030
0
0
n/a
graph
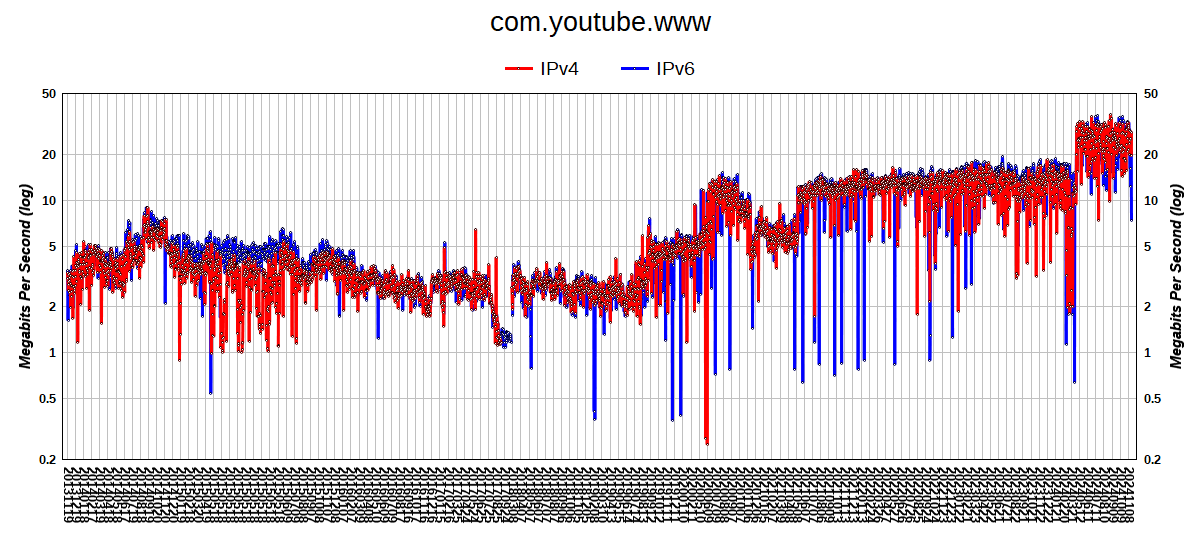
com.youtube.www
[v4R]
1/0.034554s
[v6R]
1/0.055948s
0.328726
822874
19.14
0.291803
837894
21.97
115%
graph
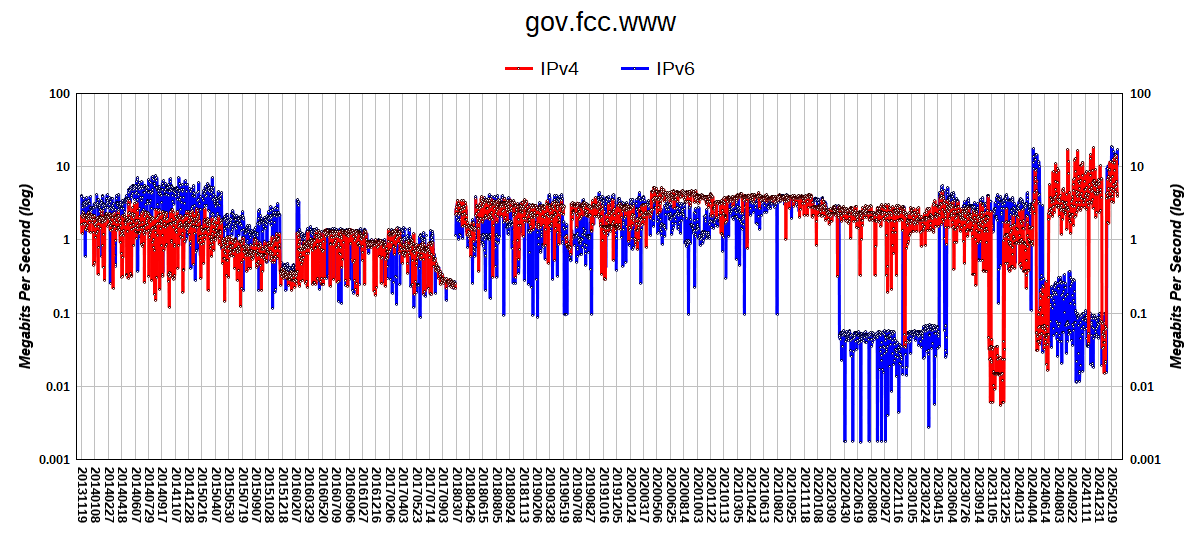
gov.fcc.www
(https)
0.050030
0
0
0.042883
0
0
n/a
graph
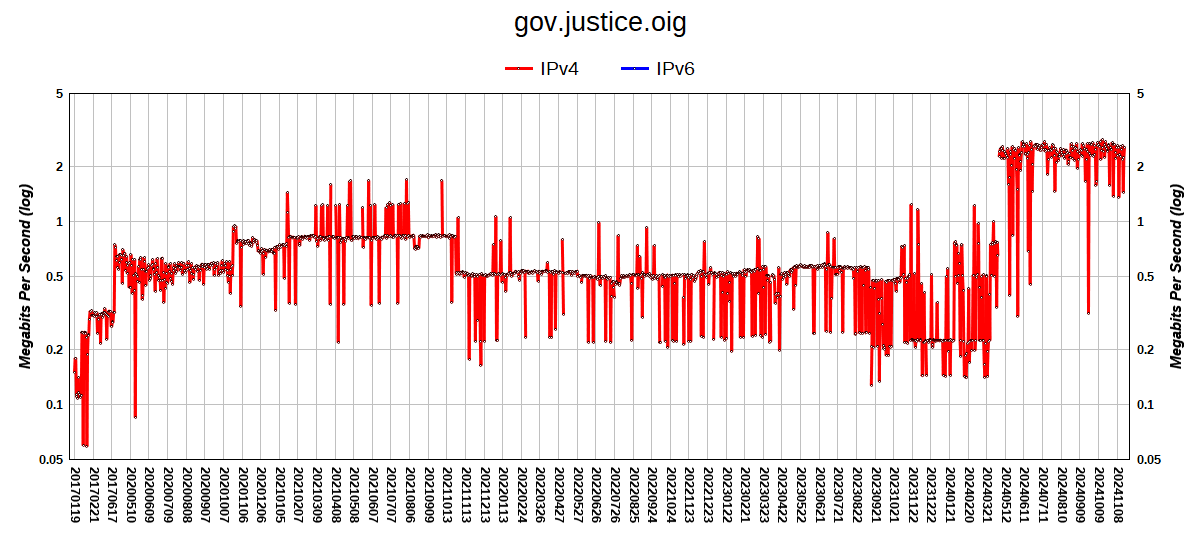
gov.justice.oig
(https)
1.799421
50125
0.21
0.733824
50125
0.52
245%
graph
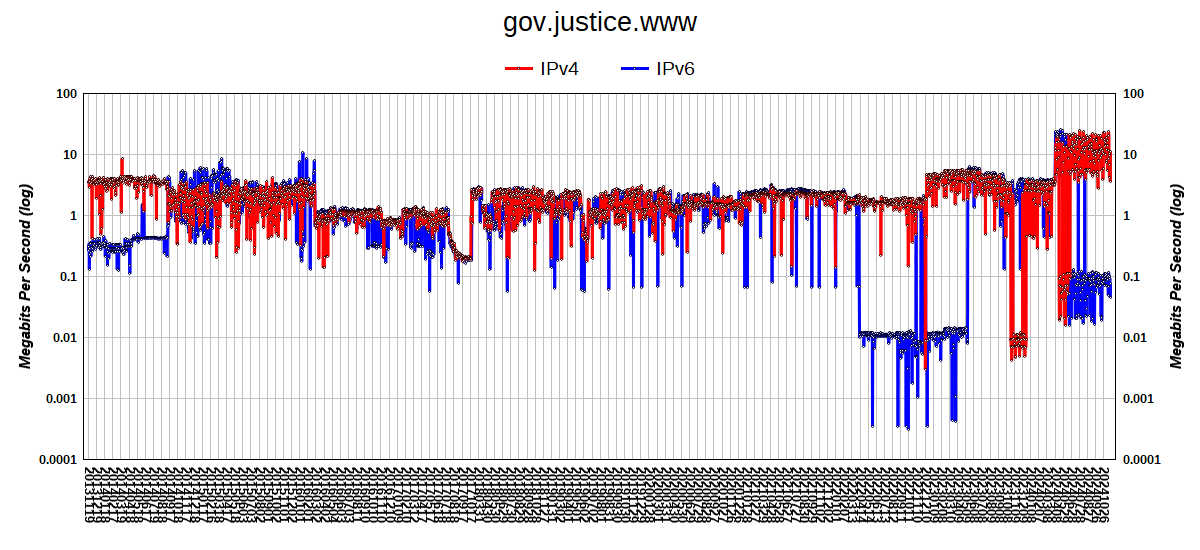
gov.justice.www
(https)
0.093377
101855
8.36
0.068870
101855
11.43
137%
graph
•
gov.projectsafeneighborhoods.www
(https)
[v4R]
1/0.042232s
[v6R]
1/0.051492s
0.139657
60311
3.31
0.106486
60311
4.34
131%
graph
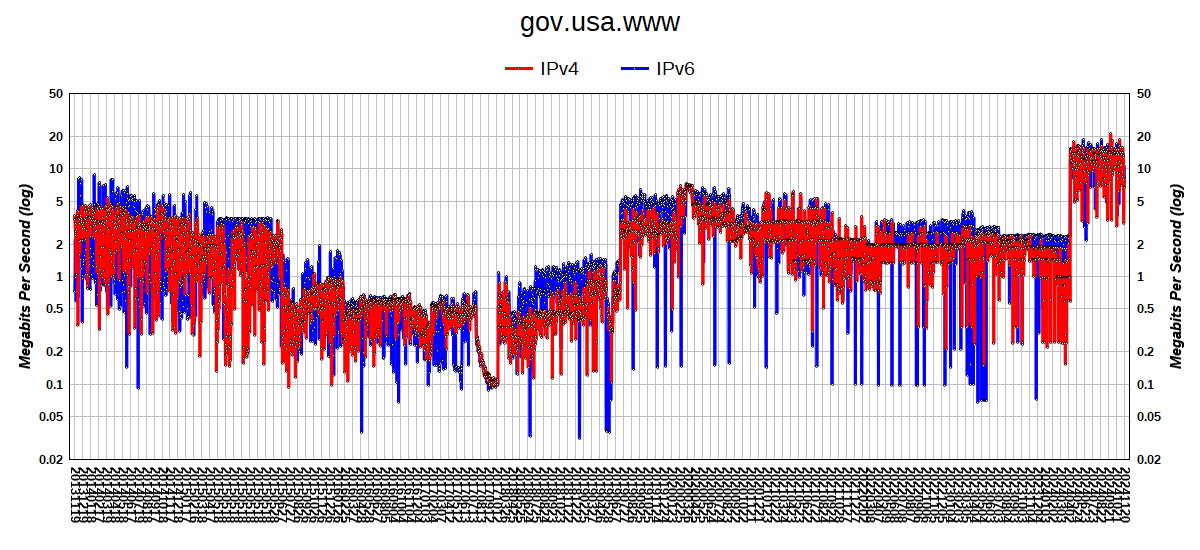
gov.usa.www
(https)
0.027948
47199
13.34
0.099851
47199
3.64
27%
graph
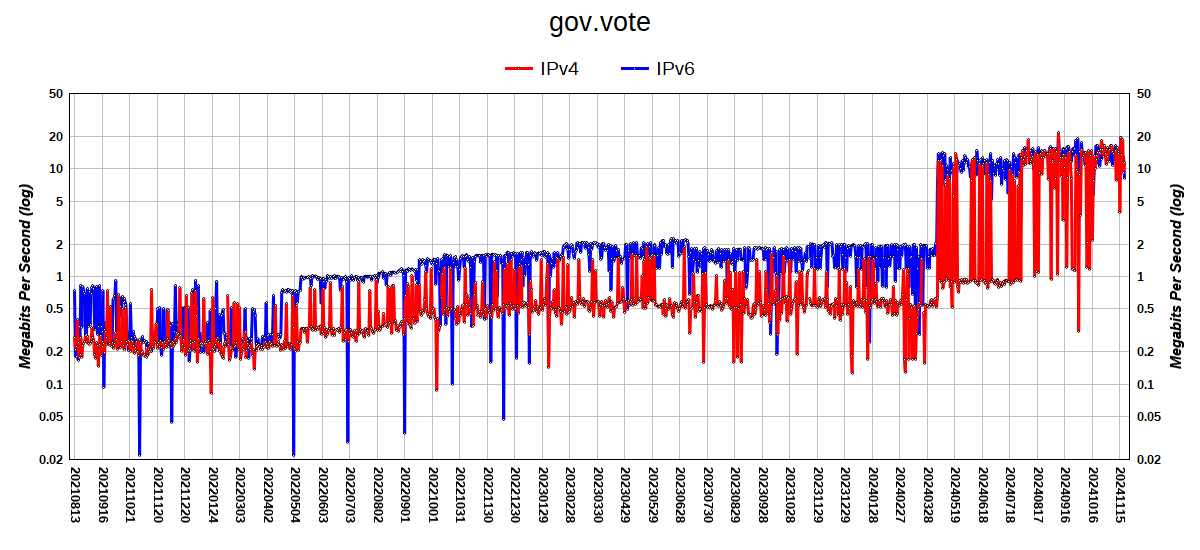
gov.vote
(https)
0.037791
5314
1.10
0.044197
5356
0.93
85%
graph
IPv6 operational:
100%
of linked subdomains (1/1),
86%
of all linked domains (12/14)
v4[s]
v4[B]
v4[Mbps]
v6[s]
v6[B]
v6[Mbps]
6/4[Mbps]
v4|v6
For comments, questions or suggested domains please contact:
[email protected]

