gov.go.
Referenced Domain IPv4/IPv6 Web Statistics
Background and Methodology
IPv6 & DNSSEC SnapShots
USG IPv6 & DNSSEC Statistics
USG IPv4 Statistics
Industry IPv6 & DNSSEC Statistics
Industry IPv4 Statistics
University IPv6 & DNSSEC Statistics
University IPv4 Statistics
CFO Act Agency Summary Statistics
USG IPv6 Enabled WWW Sites
- Referenced Domain Web Statistics for 2026.07.21 -
gov.go. |
General Services Administration
v4[s]
v4[B]
v4[Mbps]
v6[s]
v6[B]
v6[Mbps]
6/4[Mbps]
v4|v6
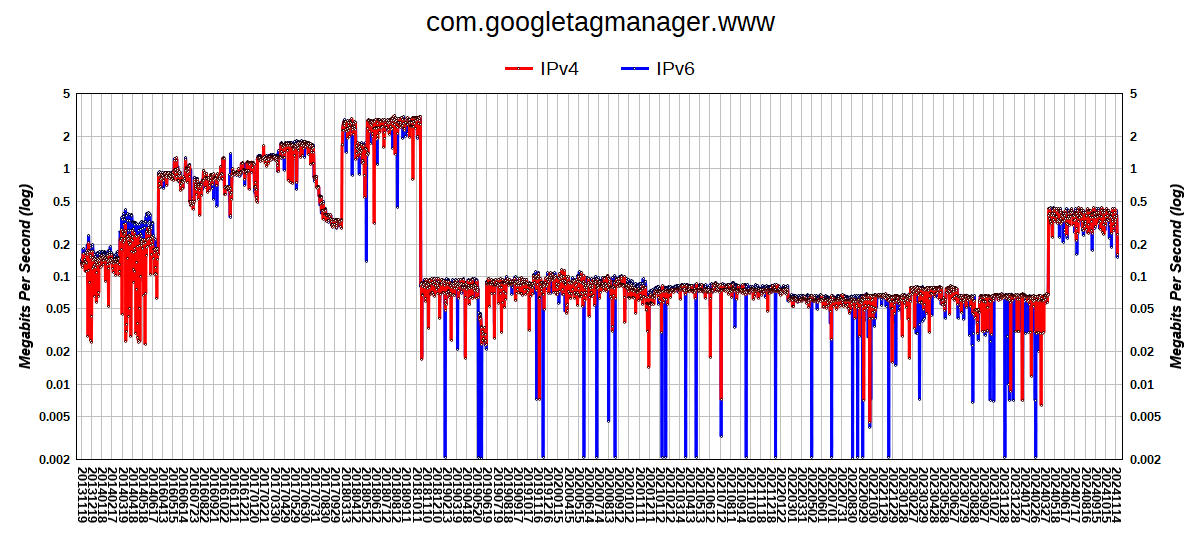
com.googletagmanager.www
(https)
0.043476
1561
0.28
0.045932
1561
0.26
96%
graph
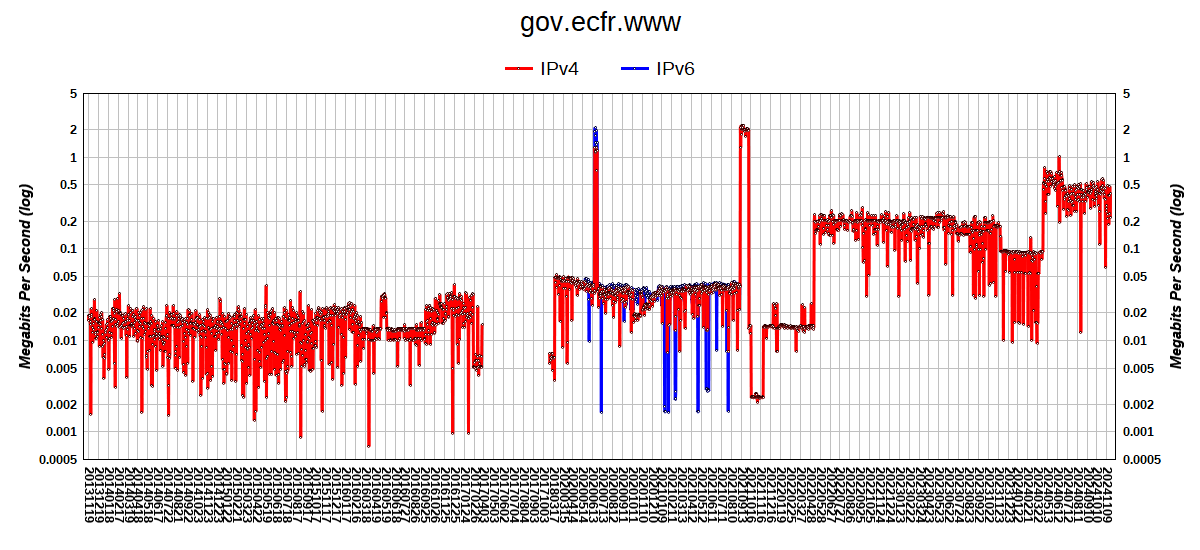
gov.ecfr.www
(https)
[v4R]
1/0.042435s
0.085508
10596
0.95
0.004126
0
0
n/a
graph
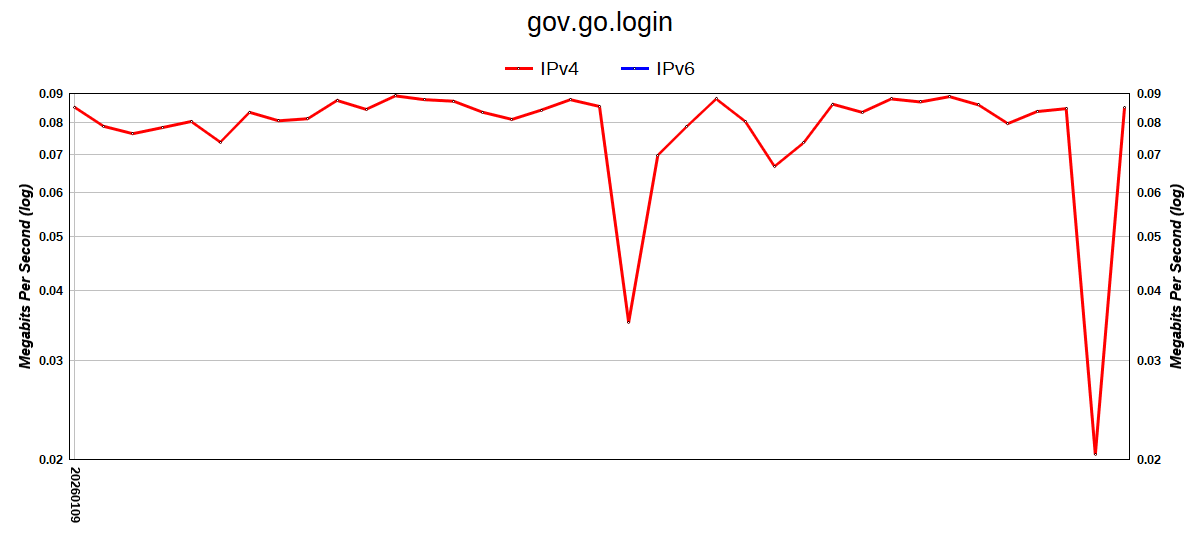
gov.go.login
(https)
[v4R]
1/0.557164s
0.638153
7774
0.09
0.004117
0
0
n/a
graph
•
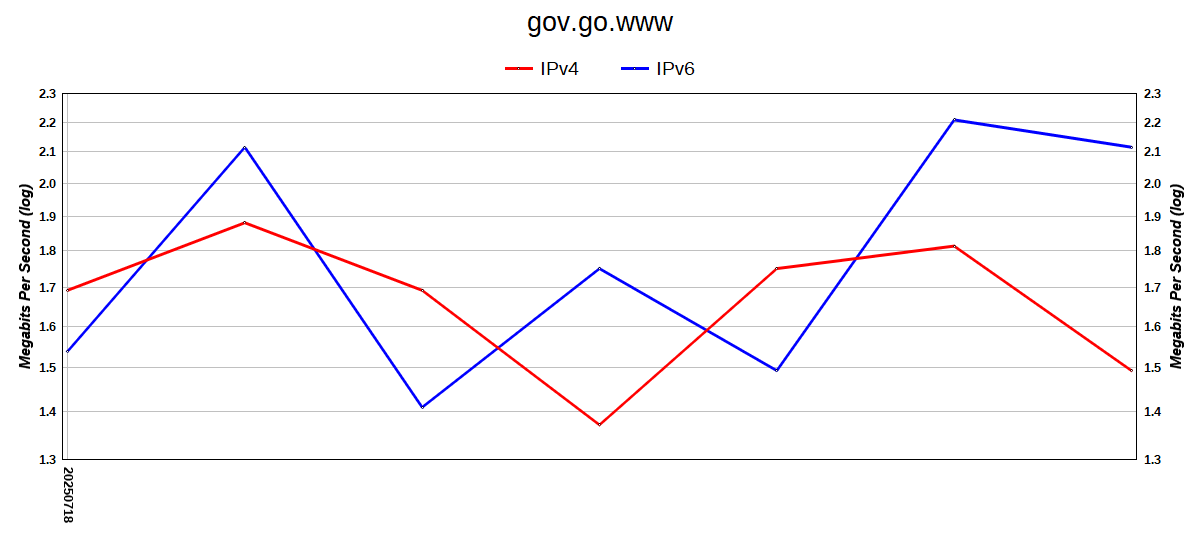
gov.go.www
(https)
0.072352
26713
2.83
0.086302
26713
2.37
84%
graph
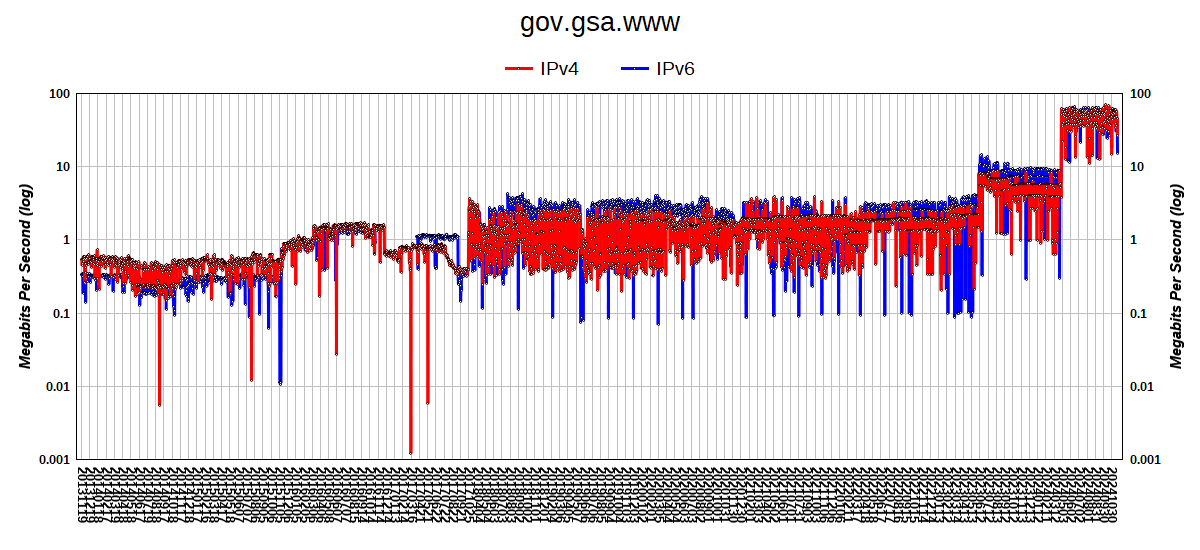
gov.gsa.www
(https)
0.063883
188512
22.83
0.044561
188512
32.69
143%
graph
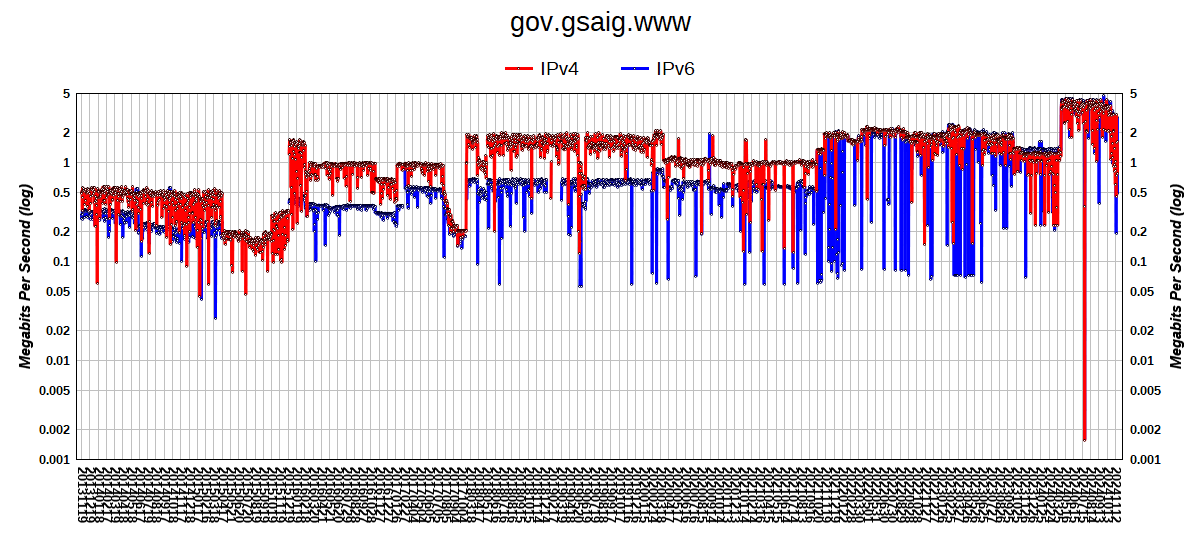
gov.gsaig.www
(https)
0.404309
65501
1.24
0.151004
65501
3.31
268%
graph
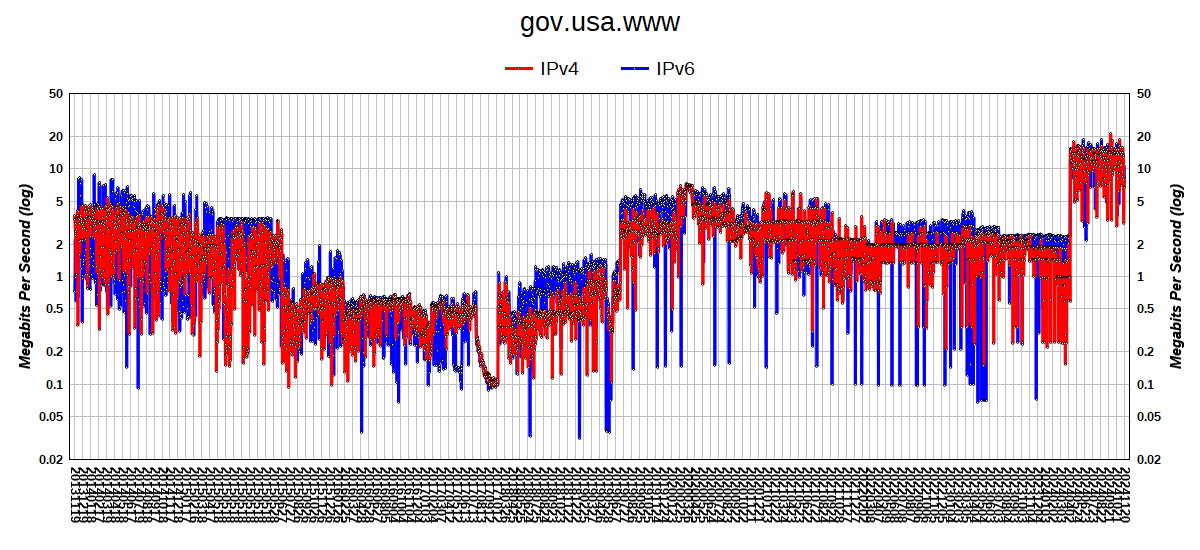
gov.usa.www
(https)
0.040649
47199
9.00
0.052525
47199
6.92
77%
graph
IPv6 operational:
50%
of linked subdomains (1/2),
71%
of all linked domains (5/7)
v4[s]
v4[B]
v4[Mbps]
v6[s]
v6[B]
v6[Mbps]
6/4[Mbps]
v4|v6
For comments, questions or suggested domains please contact:
[email protected]
